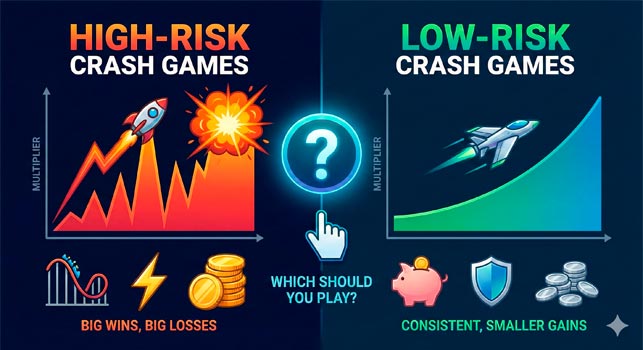
In crash games, a lower cashout target trades a smaller payout for more frequent wins. A higher target produces fewer wins with larger payouts. That changes volatility: how widely your results can vary. The amount of money at risk also depends on your stake, the number of rounds and any second bet placed alongside the first.
Does a lower target improve the odds? It increases the chance of cashing out that bet. In the model below, it does not improve the expected return per dollar wagered. Winning more bets and finishing a session in profit are different things.
Same expected return, different volatility
The examples use an idealised 97% RTP model with independent rounds, a fixed stake and a fixed cashout target above 1.00×. A successful cashout pays the full target multiplier, including the stake. There are no payout caps, fees, bonuses, rounding effects or failed cashouts in these calculations.
Win probability: p = r / M
r = RTP as a decimal, here 0.97
M = cashout target, such as 1.50 or 10.00
Expected net result per $1 bet = p × M − 1 = −$0.03
This formula defines the comparison model. An RTP percentage by itself does not establish a particular game’s exact chance of reaching each target; that also requires its result formula and settlement rules.
Under these assumptions, both 1.50× and 50.00× targets return an expected $0.97 per $1 wagered. At $100 in total wagers, the expected loss is $3 for either target. Actual results can be much better or worse. See RTP and house edge for the difference between theoretical return and a session balance.
Low and high cashout targets compared
| Target | Win probability | Net profit on a win | Chance the next 10 bets all lose |
|---|---|---|---|
| 1.50× | 64.67% | +$0.50 | 0.0030% |
| 3.00× | 32.33% | +$2.00 | 2.01% |
| 10.00× | 9.70% | +$9.00 | 36.05% |
| 50.00× | 1.94% | +$49.00 | 82.21% |
Every losing bet in this table loses $1. At 1.50×, two wins are needed to offset one loss. At 10.00×, one win offsets nine losses. A 50.00× win offsets 49 losses, because the $50 total return includes the winning bet’s own $1 stake.
Lower targets
More frequent cashouts and smaller fluctuations at the same stake. A high win rate can still leave a net loss when each win earns less than a lost bet costs.
Higher targets
Less frequent cashouts and wider fluctuations at the same stake. Long periods without a win become more likely; a large payout does not guarantee recovery of earlier losses.
Losing streaks: the next 30 rounds versus a whole session
For independent bets with win probability p, the chance that the next k bets all lose is (1 − p)k. At a 10.00× target in this model, p = 0.097:
- The next 10 bets all lose: 36.05%.
- The next 30 bets all lose: 4.68%.
- At least one run of 30 consecutive losses occurs somewhere within 500 bets: 92.23%.
The last figure assumes all 500 bets are played at the same target. It counts a qualifying run anywhere in that sequence, rather than only at its beginning. It is calculated by tracking the current run of consecutive losses after each bet; overlapping runs are not treated as independent events.
A longer session gives a losing streak more opportunities to begin. The chance of encountering a streak somewhere in that session is therefore higher than the chance of starting with one. An average streak length is not a maximum: longer runs remain possible.
After 30 losses, the next bet still has a 9.70% win probability under these assumptions. Past losses do not make a win overdue.
A high win rate does not guarantee a profitable session
For N bets of size s, with W wins at multiplier M, the net result is:
Net result = s × (M × W − N)
Suppose 50 bets of $1 at 10.00× produce three wins. The total return is $30 against $50 wagered, giving a $20 loss. That is one possible outcome, not the expected result: the model’s expected loss over those 50 bets is $1.50.
For a longer comparison, assume all 100 bets below can be funded and completed, with no early stopping. The number of wins follows the binomial distribution. The figures count strictly positive net results; breaking even is excluded.
| Target | Wins needed for a profit | Probability of finishing in profit |
|---|---|---|
| 1.50× | 67 or more | 35.40% |
| 3.00× | 34 or more | 39.70% |
| 10.00× | 11 or more | 37.74% |
| 50.00× | 3 or more | 30.69% |
At 1.50×, even winning 66 of 100 bets leaves a $1 loss. At 10.00×, ten wins break even. The chance of finishing ahead depends on the number of rounds and these payout thresholds; it does not simply rise as the target falls.
All four rows still have the same $3 expected loss. A higher chance of a profitable session is not the same as a higher expected return.
How stake size changes the risk
At a fixed target, halving the stake halves every possible cash gain or loss. At a fixed stake, increasing the target raises the spread of possible results in this model.
One measure of that spread is standard deviation. With RTP r, target M and stake s, its value for one bet is:
Standard deviation = s × √[r × (M − r)]
For 100 independent $1 bets, the standard deviation of the total result is about $7.17 at 1.50× and $29.60 at 10.00×. Both have an expected result of −$3. Standard deviation describes dispersion; it is not a limit on how much can be lost.
A smaller stake at a higher target can bring the cash fluctuations closer to those of a larger stake at a lower target. Matching standard deviation, however, does not also match the chance of a losing session, the longest losing streak or the risk of running out of funds.
What a bankroll measured in bets actually tells you
A $20 budget with a fixed $0.50 stake contains 40 stake units. It can fund 40 consecutive losing bets; the balance then reaches zero. Wins may extend play, but that calculation alone does not predict session length or establish that the budget is sufficient for a particular target.
Assess the stake against a spending limit you can afford to lose. For multiple bets in one round, count their combined stake. Increasing the budget to withstand more losses does not improve the game’s expected return. Our bankroll management guide covers stake units and spending limits.
Splitting a stake across two targets
Two bets in the same crash round have separate cashout targets but share the crash point. They are not independent attempts.
Consider a total stake of $2: $1.50 at a 1.50× target and $0.50 at a 10.00× target. With successful settlement at each reached target:
| Accepted cashouts | Total returned | Net result |
|---|---|---|
| Neither bet cashes out | $0 | −$2.00 |
| Only the 1.50× bet cashes out | $2.25 | +$0.25 |
| Both bets cash out at their targets | $7.25 | +$5.25 |
Here the lower cashout covers the combined stake when it succeeds. It offers no protection against a crash before that target. Under the 97% model, the expected net result remains −$0.06 per $2 round.
This differs from adding an extra stake to an existing bet: adding a second bet increases the money exposed. For a game-specific explanation of the controls, see our Aviator review.
Changing targets after losses
A loss does not change the next round’s probabilities in an independent-round model. Moving from 1.50× to 10.00× after a bad run raises volatility at the same stake; it does not create a mathematical recovery advantage.
Starting a new session does not reset the house edge either. A spending limit is useful because it limits further exposure, not because stopping or restarting makes future rounds more favourable. If you are raising stakes or targets primarily to recover losses, stop the session rather than increase the amount at risk.
Frequently asked questions
Are low-risk crash games safe?
No cashout target makes a bet safe. A lower target can reduce volatility at the same stake, but the bet can still lose and the house edge remains. The label “low risk” describes a comparison, not protection of your balance.
Does a higher target mean a higher house edge?
Not in the model used here: the expected loss is 3% of turnover at every illustrated target. A real game’s payout caps, rounding or target-dependent rules can change the comparison, so the result formula matters as well as the headline RTP.
Is there a maximum losing streak?
There is no fixed mathematical maximum across unlimited independent rounds when a bet can lose. A session’s length limits the longest streak you can observe within that session; an average does not provide a safety threshold.
How much bankroll do I need for high-risk play?
No fixed number of stake units guarantees a win or a profit. Evaluating the chance of exhausting a balance requires the stake, target, number of rounds and stopping rules. A spending limit should reflect what you can afford to lose, rather than a promise that a win will arrive before the balance runs out.
These comparisons explain gambling risk; they do not provide a way to earn a reliable income. Set spending and time limits, and do not borrow or increase deposits to chase losses. Visit our responsible gambling page for further guidance.