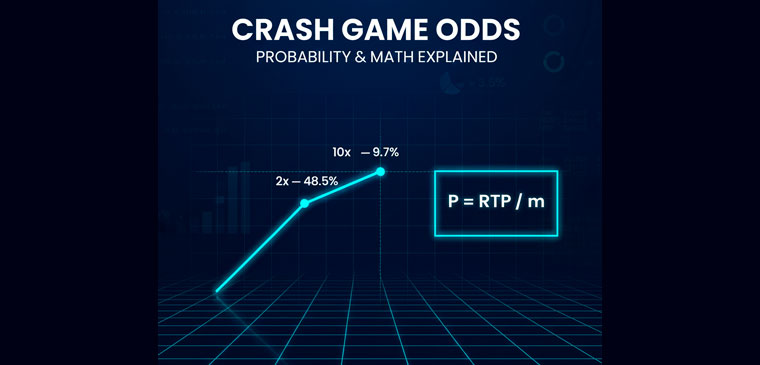
Quick answer: In the common uncapped inverse crash model, the approximate probability of reaching a target multiplier m is RTP ÷ m. At 97% RTP, that gives 48.5% for 2×, 9.7% for 10×, and 0.97% for 100×. This rule is useful, but it is not universal: provider-specific rounding, minimum results, maximum multipliers, and alternative payout mappings can change the exact probability.
Crash game odds answer a specific question: what is the probability that the round survives long enough for a chosen cash-out target to be reached? That is different from asking for the probability of an exact displayed crash point, the chance of seeing at least one high multiplier during a session, or the expected profit from a betting strategy.
This guide separates those questions and fixes a common expected-value error. It uses an idealized inverse-distribution model for the main calculations, then explains where real games can differ. For provider-specific formulas, see the Crash Game Algorithm Guide. For verified RTP values, use the Crash Game RTP Guide.
Model assumptions: The target is no higher than the game’s maximum multiplier; the quoted multiplier is the gross payout including the returned stake; rounds behave like independent pseudorandom outcomes; and bonuses, cashback, fees, partial cash-outs, and changing bet sizes are excluded.
The Core Crash Game Odds Formula
Let r be RTP as a decimal and m be the target multiplier. In the standard inverse model:
The symbol “≈” is deliberate. The formula is exact for an idealized continuous inverse distribution, but a real interface displays finite decimal values and may apply truncation, rounding, a 1.00× floor, or a maximum multiplier. Those implementation details create small differences around display boundaries.
Example: 2× at 97% RTP
0.97 ÷ 2.00 = 0.485, so the idealized chance of reaching at least 2.00× is 48.5%.
Example: 100× at 99% RTP
0.99 ÷ 100 = 0.0099, so the idealized chance is 0.99%, or an average of about one qualifying round per 101 rounds. That average is not a schedule or a guarantee.
Crash Multiplier Probability Table
The table below applies r ÷ m. It should be read as an idealized reach probability, not as a provider guarantee.
| Target | 95% RTP | 97% RTP | 99% RTP |
|---|---|---|---|
| 1.01× | 94.1% | 96.0% | 98.0% |
| 1.10× | 86.4% | 88.2% | 90.0% |
| 1.50× | 63.3% | 64.7% | 66.0% |
| 2.00× | 47.5% | 48.5% | 49.5% |
| 3.00× | 31.7% | 32.3% | 33.0% |
| 5.00× | 19.0% | 19.4% | 19.8% |
| 10× | 9.50% | 9.70% | 9.90% |
| 20× | 4.75% | 4.85% | 4.95% |
| 50× | 1.90% | 1.94% | 1.98% |
| 100× | 0.950% | 0.970% | 0.990% |
| 500× | 0.190% | 0.194% | 0.198% |
| 1,000× | 0.095% | 0.097% | 0.099% |
For any target not listed above, use the Multiplier Probability Calculator. The result should still be checked against the game’s maximum multiplier and current rules.
Average Frequency Is Not a Payout Cycle
If a target has probability p, the average number of rounds per qualifying result is 1 ÷ p. The chance of seeing at least one qualifying result within n rounds is:
| Target | Per-round probability | Average rounds per hit | At least one in 10 rounds | At least one in 100 rounds |
|---|---|---|---|---|
| 2.00× | 48.5% | 2.06 | 99.87% | >99.99% |
| 5.00× | 19.4% | 5.15 | 88.43% | >99.99% |
| 10× | 9.70% | 10.31 | 63.95% | >99.99% |
| 20× | 4.85% | 20.62 | 39.17% | 99.31% |
| 50× | 1.94% | 51.55 | 17.79% | 85.90% |
| 100× | 0.970% | 103.09 | 9.29% | 62.27% |
| 500× | 0.194% | 515.46 | 1.92% | 17.65% |
| 1,000× | 0.097% | 1,030.93 | 0.97% | 9.25% |
A 100× result has an average interval of about 103 rounds at 97% RTP, yet the chance of seeing at least one in a particular 100-round sample is only about 62.27%. Long gaps and clusters are both compatible with the same probability. The average interval does not mean the game becomes “due” after 103 rounds.
Reaching 2.00× Is Not the Same as Crashing at Exactly 2.00×
The reach probability includes every result at or above the target. At 97% RTP, approximately 48.5% of idealized rounds reach 2.00× or higher. The probability of the display showing exactly 2.00× is much smaller.
If an implementation truncates to two decimal places, an exact displayed value of 2.00× corresponds approximately to raw results from 2.00 up to, but not including, 2.01:
That is about one displayed 2.00× result per 414 rounds in this simplified model. A provider that rounds instead of truncating uses different bucket boundaries, so exact-display probabilities must be derived from its actual code.
Correct Expected-Value Math
For a stake of B, target multiplier m, and win probability p, the gross return on a win is mB. The expected net result is therefore:
For a $1 bet at 97% RTP, the idealized expected result is −$0.03 per round, regardless of whether the fixed target is 1.50×, 2×, 10×, or 100×. The target changes the distribution of wins and losses, not the theoretical return.
Common accounting mistake: Do not multiply the win probability by the gross payout and then subtract the loss probability again. The expression p × mB − B already subtracts the original stake for every round. An equivalent net-outcome formula is p × (m − 1)B + (1 − p) × (−B).
Same Expected Value, Different Losing-Streak Risk
A lower target wins more frequently but produces a smaller net profit when it succeeds. A higher target wins less frequently and creates much longer losing sequences. Under the 97% idealized model, the chance of k consecutive losses at a fixed target is (1 − p)k.
| Cash-out target | Win probability | Net profit on a $1 win | Chance of 5 losses in a row | Chance of 10 losses in a row |
|---|---|---|---|---|
| 1.50× | 64.7% | 0.50 units | 0.551% | 0.003% |
| 2.00× | 48.5% | 1.00 units | 3.623% | 0.131% |
| 5.00× | 19.4% | 4.00 units | 34.015% | 11.570% |
| 10× | 9.70% | 9.00 units | 60.040% | 36.048% |
| 100× | 0.970% | 99.00 units | 95.243% | 90.713% |
This is why 1.50× can feel safer while 100× can consume a bankroll quickly. “Safer” here means lower variance and shorter typical losing runs, not a better expected return. Bet progression systems such as Martingale change exposure and tail risk but do not change the underlying expected value.
Why the Formula Is Not Exact for Every Crash Game
Rounding and truncation
Provider code may floor, round, or otherwise map the raw value to two decimal places. This changes the probability of exact displayed values and can slightly affect boundary targets.
Minimum result
Many implementations consolidate low raw outputs at 1.00×. The displayed 1.00× rate is not automatically identical to the stated house edge.
Maximum multiplier
If a game caps results, a target above the cap has zero probability. A cap can also change expected-value calculations near the top of the distribution.
Different mappings
Not every crash-style game uses the same inverse formula. Some providers use payout tables, explicit instant-bust conditions, or proprietary result conversion.
BC.Game’s published Crash example converts 52 bits into X, calculates 99 ÷ (1 − X), floors the result, divides by 100, and applies a 1.00× minimum. The current official Bustabit verifier uses the same main 52-bit inverse mapping after HMAC-SHA256. Stake documents Crash separately from its standard per-player game-event calculations and links to its salt-hash seeding model. These implementations are close enough for r ÷ m to be useful, but not interchangeable for exact round verification.
Instant Crashes and the 1.00× Result
It is unsafe to infer that a 3% house edge must produce exactly 3% of rounds at 1.00×. House edge describes expected return, while the displayed minimum depends on the provider’s formula and decimal handling.
For example, an implementation may clamp every raw result below 1.00× to 1.00×. If it also truncates to hundredths, some raw results between 1.00× and 1.01× will also display as 1.00×. Another provider may use a separate explicit instant-bust condition. The only reliable source for the exact minimum-result probability is the current provider code, verifier, or rules.
Expected Session Cost
Expected loss is driven by total turnover, not by the number of winning rounds:
- $1 per bet × 100 bets × 3% edge = approximately $3 expected loss.
- $5 per bet × 200 bets × 1% edge = approximately $10 expected loss.
- Doubling the stake or number of rounds doubles expected loss.
These are averages across repeated comparable sessions, not bills charged at the end of one session. Actual results can be far above or below expectation because crash games have high variance, especially at large target multipliers. Use the Session Cost Calculator for a custom estimate.
Common Questions About Crash Game Odds
What are the odds of reaching 2×?
In the idealized inverse model, the probability is RTP divided by 2. That is 47.5% at 95% RTP, 48.5% at 97% RTP, and 49.5% at 99% RTP.
What are the odds of reaching 10×?
The idealized probabilities are 9.5% at 95% RTP, 9.7% at 97% RTP, and 9.9% at 99% RTP. At 97% RTP, the chance of seeing at least one 10× result in ten independent rounds is approximately 63.95%.
What are the odds of reaching 100×?
At 97% RTP, the per-round idealized probability is 0.97%. The average interval is about 103 rounds, but the chance of at least one 100× result within a particular 100-round sample is only about 62.27%.
Is there a best cash-out multiplier?
Not by expected value in the fixed-target inverse model. Lower targets reduce variance and produce more frequent wins; higher targets increase variance and losing-streak risk. Neither removes the house edge.
Do previous multipliers change the next-round odds?
They should not in a correctly implemented cryptographic or certified random system. Hash-chain outcomes may be predetermined once committed, but public past results do not reveal the unreleased input. A streak does not make the opposite result due.
Can a betting system improve crash game odds?
A staking system can change bet size, volatility, and the chance of ruin. It cannot change the underlying probability distribution. Bonuses or cashback may change effective value, but that is a separate calculation from the base game odds.
Primary Sources and Calculation Notes
- BC.Game White Paper: Provably Fair — published 52-bit Crash example and the
99 ÷ (1 − X)mapping. - Bustabit Official Verifier: Multiplier Math — HMAC-SHA256, 52-bit extraction, flooring, and 1.00× minimum.
- Stake Provably Fair: Game Events — identifies Crash as using a separate salt-hash model.
- Stake Crash — current stated 99% RTP, 1% edge, and maximum multiplier information.
Last calculation review: July 23, 2026. Probability tables were recalculated from the stated formulas. Provider rules and implementations can change, so verify the current game information before applying the figures to real-money play.
Responsible gambling: Understanding probability does not remove negative expected value. Set limits on stake, turnover, and time. Do not chase a multiplier because it has not appeared recently.
Related Guides and Tools
- Multiplier Probability Calculator — calculate reach probability for a custom target and RTP
- Crash Game Algorithm — compare provider formulas and hash mappings
- Crash Game RTP and House Edge — provider RTP values and expected cost
- Session Cost Calculator — estimate loss from stake, pace, and edge
- Crash Game Strategy — fixed targets, Martingale, and variance
- Bankroll Management — control bet size and session exposure
- Can You Predict Crash Games? — why chart patterns do not reveal hidden inputs